
Figure 1: Cross-section of the laryngeal tube. Note the ventricular folds labeled as the vestibular folds (also known as the false vocal folds) and the vocal folds (Larynx, Online Image).

Figure
2: A tube model illustrating the vocal tract. The vocal folds are
illustrated at the left end of the model and the larynx tube and
ventricular fold are depicted as constrictions within the vocal
tract. This particular model is illustrating constrictions in the
vocal tract during Tuvan Throat Singing (Imagawa et al., 2003).
Modal Voicing Data
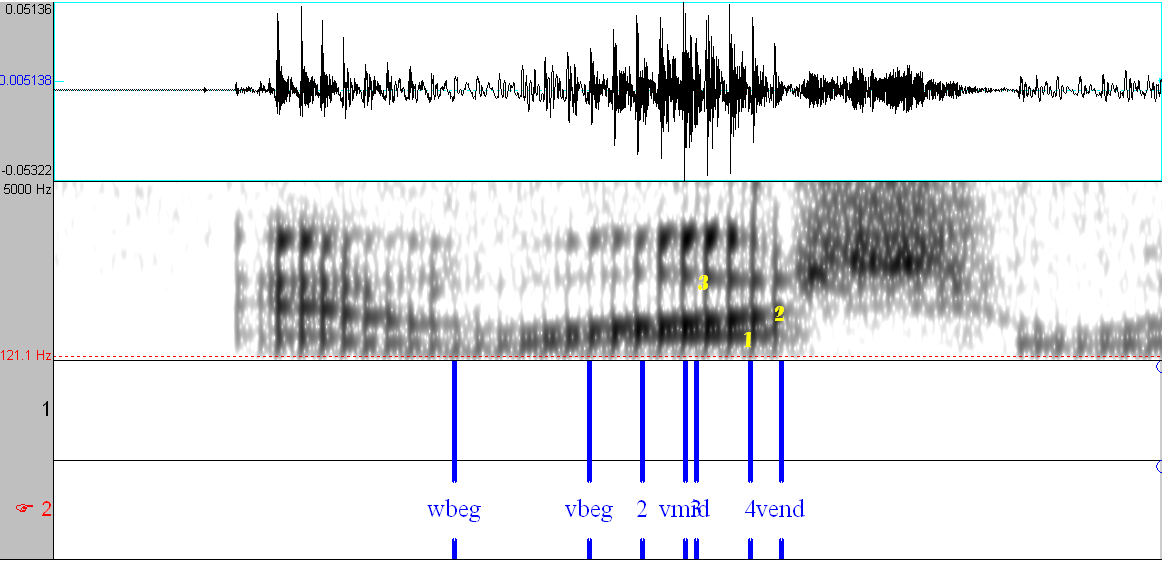
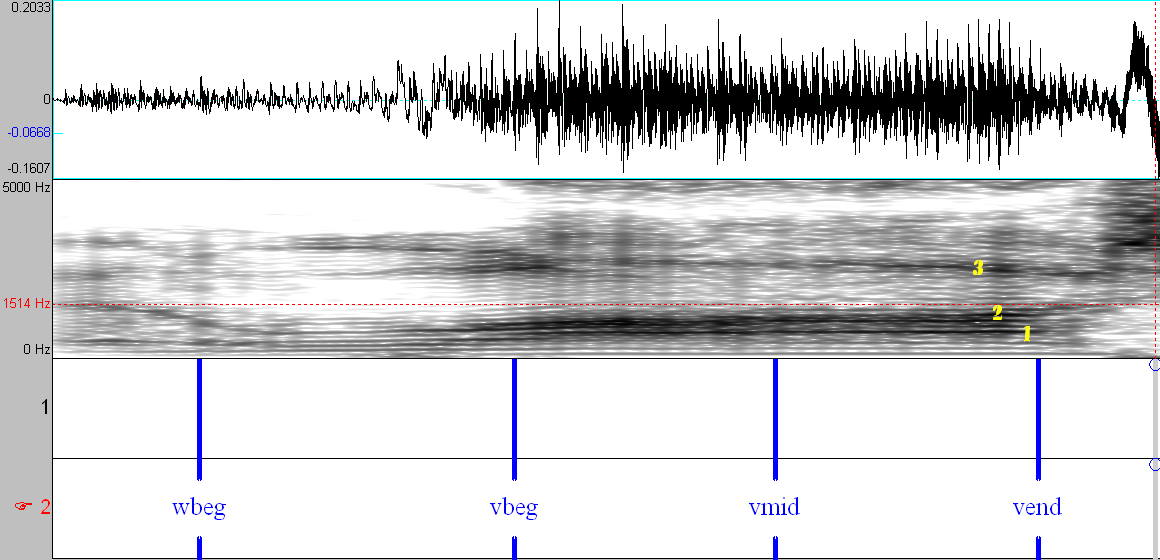
Figure
3: Spectrogram, waveform, and textgrid marking vowel boundaries
and preceding [w] boundary. This is the comparative modal
spectrogram for the following data. Note the amount of white
noiseless space and banding of the first formants. The formants
are labeled by their number.
Figure
4: Waveform of modal voicing displaying three glottal cycles.
Figure
5: Formant tracking of modal voicing during vowel articulation of
first three formants.
Creaky Voice Data
Figure
6: Spectrogram, waveform, and textgrid representations. Note the
vertical banding in the spectrogram corresponding to the high
amplitude pulses in the waveform.
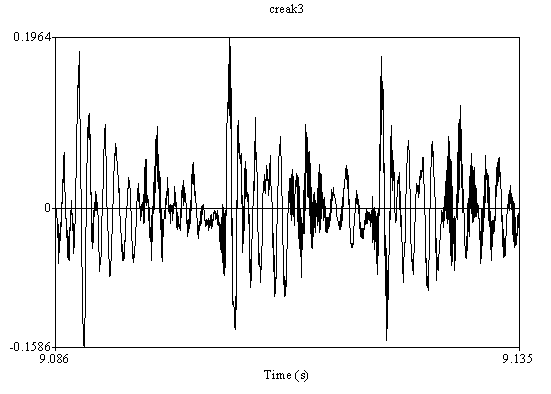
Figure
7: Three creaky voice glottal cycles in waveform.
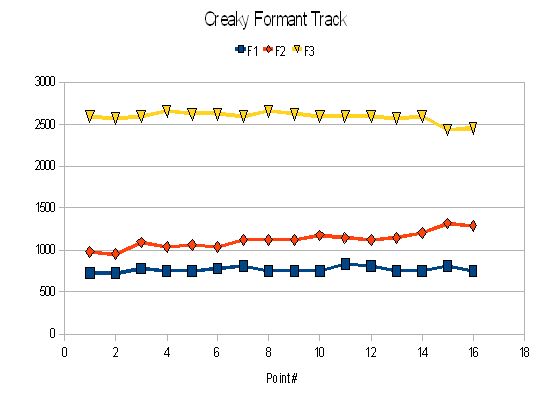
Figure
8: Tracking the first three formants of the creaky voice during
vowel articulation.
Breathy Voice Data
Figure
9: Spectrogram, waveform, and textgrid illustrating breathy
voicing style. Note the high level of low amplitude noise compared
to modal voicing.
Figure
10: Three glottal cycles in breathy voice displayed as waveform.
Figure
11: Tracking the first three formants of breathy voice.
Raspy Voice Data
Figure
12: Spectrogram, waveform, and textgrid illustrating raspy voice.
Again, there is a high level of noise in the spectrogram. The
first two formants are less obscured than breathy voice and there
is a zero (white space) around 4234Hz.
Figure
13: Waveform displaying three glottal cycles.
Figure
14: The first three formants of the rasp tracked.
Scream Data
Figure
15: Scream spectrogram, waveform, and textgrid represented. We see
the highest amplitude noise with this voicing type obscuring the
third formant. The overall frequency of the formants in scream
voicing are higher than modal and the other voicing techniques.
Figure
16: Three glottal cycles with scream voicing.
Figure
17: Formant tracking of the first three formants in scream.
Death Grunt Data
Figure
18: Death grunt spectrogram, waveform, and textgrid with first
three formants labeled. Notice the zero that extends from [w] into
the vowel and the high amplitude noise above the third formant.
Figure
19: Three death grunt glottal cycles shown as soundwave.
Figure
20: Death grunt formant track of the first three formants.
Additional Data
Figure
21: Spectrogram of raspy voicing technique drawn with narrow
banding to give more details. Notice the bands below the first
formant. These represent the vibrations of the ventricular during
articulation in raspy voice.
Works Referenced
The
Larynx.
Online Image. 7 April. 2009
<http://www.hopkinsmedicine.org/voice/anatomy.html>.
Imagawa, Hiroshi, Sakakibara, Ken-Ichi, Tayama, Niro, and Seji Niimi. “The effect of the hypopharyngeal and supra-glottic shapes on the singing voice” Stockholm Music Acoustics Conference August 2003: SMAC 1-4.